

NYC COVID Breakthroughs Updated! Part 1
NYC COVID Breakthroughs Updated! Part 1
@nycHealthy 2/24/22 Update

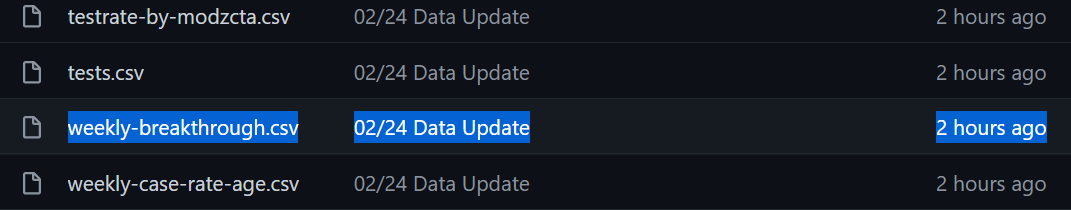
Ok, after waiting a week without explanation, we got all the way to the next weekly update. Thankfully, they updated Weekly Breakthroughs.
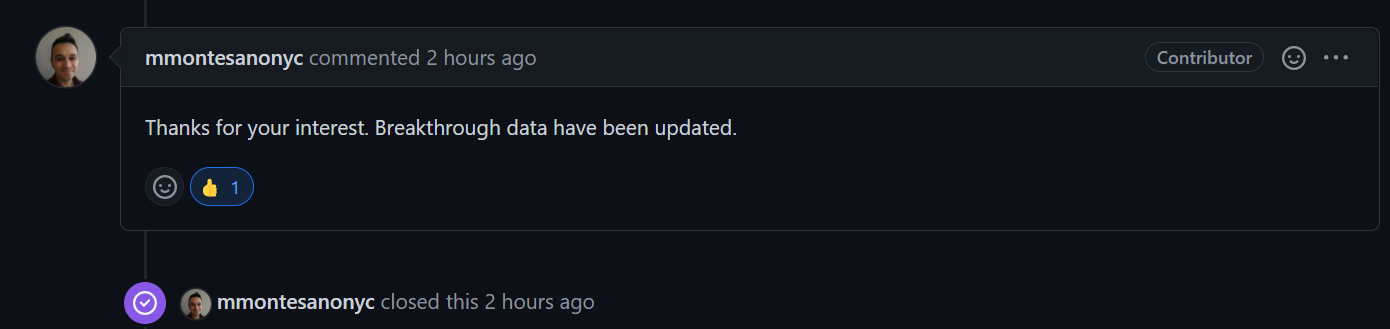
And the GitHub team responded finally today but not until the data were updated. They did not explain what happened over the past week.
Are you ready?
We got EXACTLY what we expected, and my predictions were basically perfect for Cases and Hospitalizations while being fairly close for Deaths.
These charts show my predictions and the actual results:
Cases

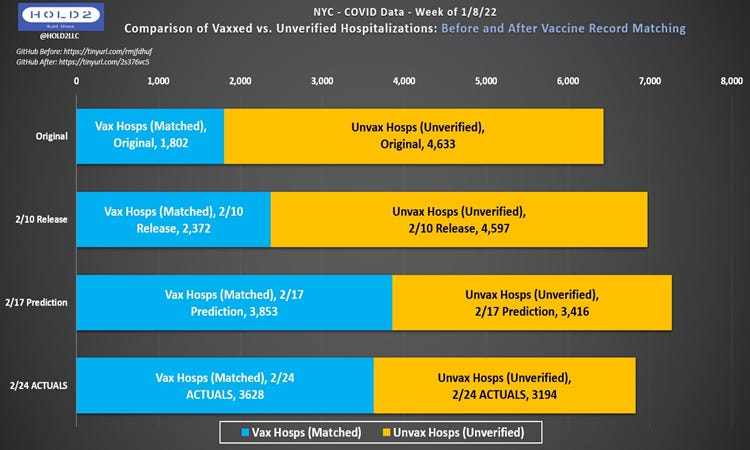
Hospitalizations
Deaths
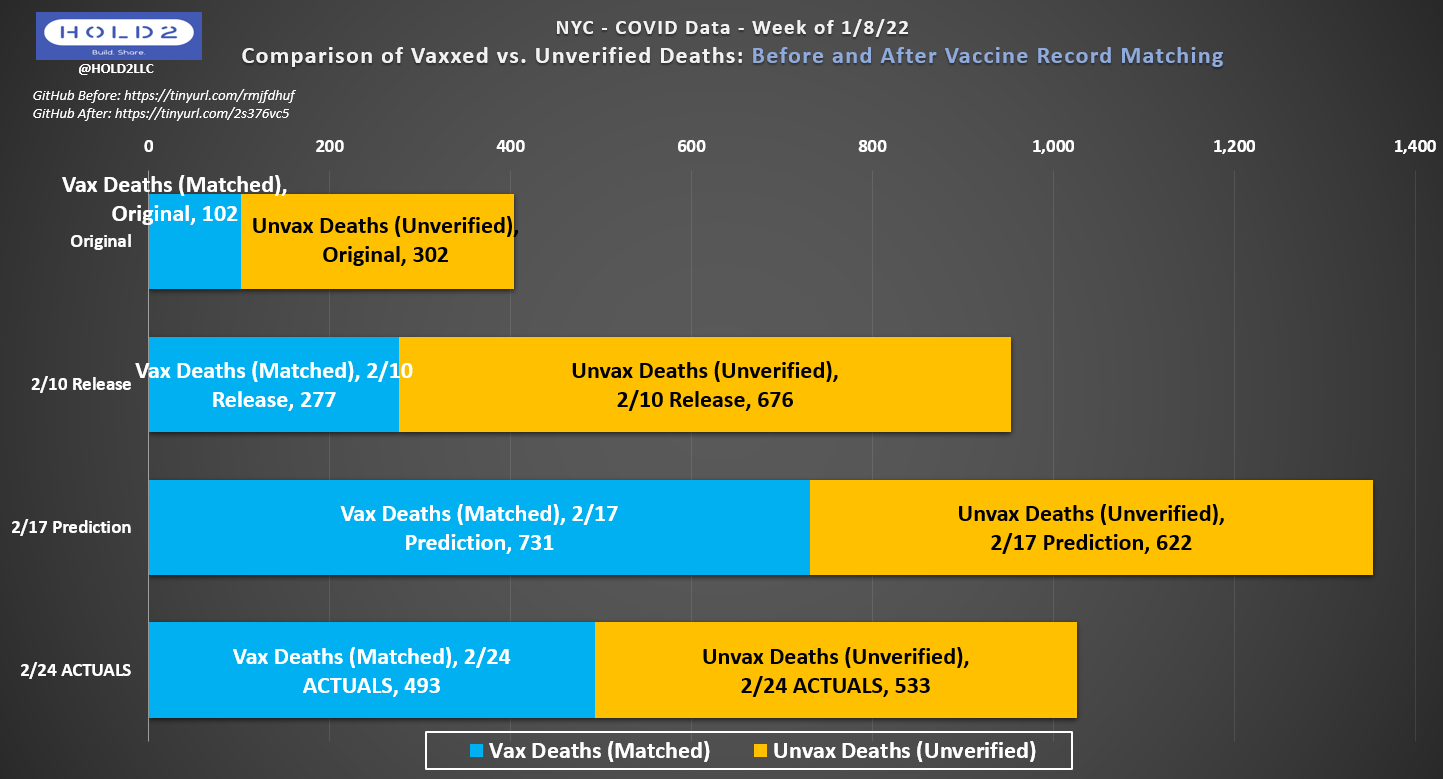
Numerically, here were the predictions and results for Week of 1/8/22 data:
Vaxxed % Predictions:
Cases: 23.19% -> 60.00% | Actual: 62.10% (+2.10)
Hospitalizations: 28.00% -> 53.01% | Actual: 53.18% (+0.17)
Deaths: 25.25% -> 54.03% | Actual: 48.05% (-5.98)
Progression from Original to 2/10 to 2/24:
Cases: 23.19% -> 38.25% -> 62.10% (+38.91, +168%)
Hospitalizations: 28.00% -> 34.04% -> 53.18% (+25.2, +90%)
Deaths: 25.25% -> 29.07% -> 48.05% (+22.8, +90%)
Net Unvax->Vax Change from Original to 2/24:
Cases: 192,412
Hospitalizations: 3,265
Deaths: 160
How could we get this close? It’s just a matter of finding consilience through pattern matching. Shout out to The Ethical Skeptic. These data aren’t done changing either. More will shift from Unvax to Vax, which we saw happen for Week of 1/1 in today’s update, too.
I have a bunch more charts to update and post, so I’ll publish this and create Part 2 next.
How confident are you regarding the accuracy of this data? I'm asking because of Scotland's data which has 80% of deaths attributed to the vaxxed and now they're going to hide it. Has NYC already been doing this?
Have you or anyone else reached out to interview the people in charge of the vaccine matching process to understand how it is done?
I assume Mr Montesano is just a data guy, so who is actually in charge of reviewing the records? Any idea?