


England Week 11 COVID Update
UKHSA 2022 Week 11 Report

Big update this week for a few reasons:
I’ve added a new Unvaccinated column that uses ONS denominators. From now on, both NIMS and ONS Unvaccinated rates will be shown.
With UK seeing Spring stimulus in this week’s report, almost the entirety of the Case increase was disproportionately among the 3-Dose cohort.
Overall, everything keeps trending towards 3-Dose as the rate difference between Unvaccinated and 3-dose decreases
For background on the ONS vs. NIMS denominator issue, see my Twitter thread from earlier this week:


Neither database can be considered “correct,” so it’s good to look at both. UKHSA justifies its use of NIMS, but it does seem likely to me that NIMS is at least inflated in the middle ages.
Conversely, ONS appears unnaturally low in the 60-79 range, and I don’t see any good reason to use the mid-2020 estimates when we are in 2022. Because of that - especially the anomalous figures for 60-79 - I will use the 2022 projections until further notice.
ONS may also be low in the highest ages, but how can we always pick whatever makes Unvax look worst? We can’t and shouldn’t.
Let’s take a look at this week’s updated data…
Links to source data first. Take note my charts are specific to England COVID outcomes and COVID vaccination:
UKHSA Current Weekly Report: https://t.co/mKt2uPv5dg
England Vaccine Uptake (Tab 62): https://t.co/NxqwUVnLJS
ONS Population Data: https://t.co/j3h9IOeKPl (Using 2022 Projections)
Cases
Raw Counts

Rates per 100k

Cases are massively dominated by the 3-dose cohort
Most adults have 3 doses, but Case rates are higher for 3-dose than for Unvaccinated in all adult age groups and for both population denominators (ONS and NIMS)
The 3-Dose cohort is recording Cases 2.2-5.4X more than Unvaccinated in ages 60+
Hospitalizations
Raw Counts

Rates per 100k
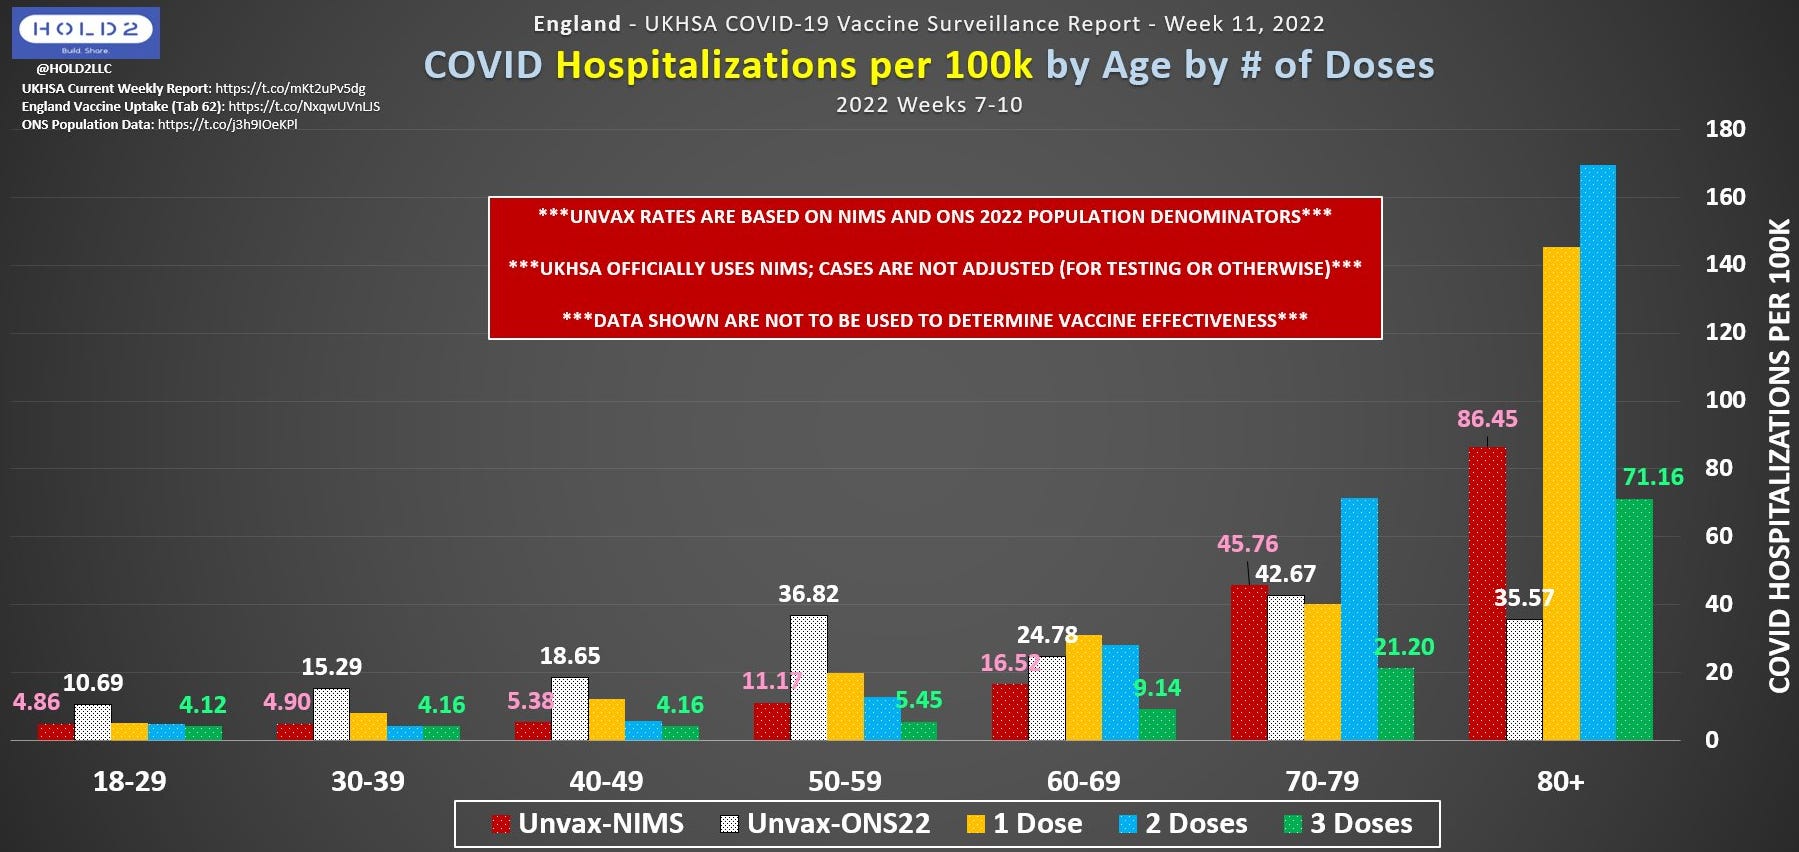
Again, Hospitalizations are massively dominated by 3-dose
But this time the rates favor 3-dose over Unvaccinated in every age group for both ONS and NIMS
Higher ages also dominate disproportionately as we’ve come to expect
NIMS rates for Unvax vs. 3-Dose are very close to 3-dose in all ages with a range of 1.18X (18-29) to 2.16X (70-79)
ONS rates for Unvax vs. 3-Dose are more erratic with a range of -2X (80+) to 6.76X (50-59).
Yes, 80+ Hospitalization rate is 2X higher for 3-Dose than Unvax-ONS22. This is not likely, but neither is the 50-59 multiple for Unvax-ON22.
Deaths
Raw Counts

Rates per 100k

For Deaths, 3-Dose dominate to a degree that cannot be understood by just looking at rates:
80+ 3-Dose raw deaths (1,230) account for more than all other deaths combined, including all deaths 0-79 + all other 80+ deaths in other dose levels (1,191), including Unlinked (11 - not shown)
Death rates still favor 3-Dose in every age for both NIMS and ONS
1-Dose and 2-Dose rates are much worse than Unvax in 80+ but also still slightly worse in 70-79. 60-69 1-Dose and 2-Dose rates match Unvax for ONS and are a little higher than NIMS.
NIMS Unvax-to-3Dose multiples range from 1.19X (18-29) to 5.26X (30-39). 40-79 are all below 4X. 80+ is down to 1.74X
ONS Unvax-to-3Dose vary wildly like Hospitalizations with a range of -1.4X (80+) to 16.41X (30-39)
Overall, what are we seeing:
3-Dose vaccinated people have completely overtaken Cases in England both in absolute and relative terms. This trend continues to worsen weekly
The advantage of being 3-Dose vaccinated against severe outcomes seems apparent in these data, but the gap is lessening rapidly
To an unknown degree. prior infection among the Unvaccinated inevitably and surely reduces COVID outcomes for the Unvaccinated cohort. We just don’t know how much of the rate convergence is due to natural immunity vs. vax waning vs. variant mutation vs. statistical unraveling of methodological/definitional aspects that favor those with recent doses (e.g. 14-day rule)
More to come…
A bunch of bonus charts after the Paywall: